What happened when one account ran a demonstration UGC video?
Short answer
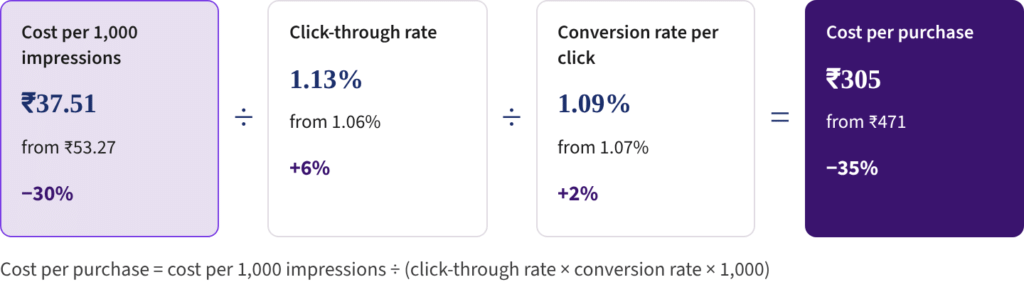
On one D2C bags account, a creator-style video that showed an anti-theft backpack being worn outdoors cost ₹305 per purchase, against ₹471 for the account’s business-as-usual ad. Both converted near 1.1% after the click, so most of the gap opened before anyone reached the site.
The account belongs to a D2C bags brand we manage in India. The video runs 53 seconds and shows a man wearing the backpack outdoors, with captions about what it holds and keeping belongings safe. It went live in late February and was still running when the data was pulled. The comparison is the account’s business-as-usual ad for a different bag, a laptop messenger.
The two ads in Meta Ads Manager · 7-day click, 1-day view
Real figures from an account we manage, brand anonymised.
The demonstration video spent about three and a half times as much and still returned more per rupee, at a lower average order value. On ROAS alone you would call it a better ad and move on. The more useful question is where the ₹166 saving on every sale came from, because the answer tells you what to repeat.
How do you tell which part of an ad lowered cost per purchase?
Short answer
Break cost per purchase into three links: cost per 1,000 impressions, click-through rate and conversion rate per click. In this account, cost per 1,000 impressions fell 30%, click-through rate rose 6% and conversion rate 2%, so about four-fifths of the ₹166 saving per sale sat in the first link.
Meta’s auction does not simply sell impressions to the highest bidder. It weighs each bid against how likely people are to respond to the ad and how good the ad is, so an ad that holds attention can win the same placement for less. Once people clicked through, both ads converted at almost the same rate, so the landing page explains little of the gap.
Read any creative test the same way. Look at cost per 1,000 impressions and click cost before ROAS. If they fall, the creative is earning attention. If only conversion rate moves, look at the page and the offer instead.
What makes a UGC script demonstrate the product?
Each line shows the product doing its job instead of naming a feature. A typical UGC brief produces the first script: a person, the product, a list of features. The second shows the product at work. We wrote both for this post to show the difference; neither is the ad that ran.
1. “Hi guys, I just got this backpack and I’m obsessed.”
2. “It has a premium faux leather finish.”
3. “Loads of space and a laptop sleeve.”
4. “There’s an anti-theft pocket too.”
5. “Link below, go get yours.”
1. Hook
“This is the most crowded part of my commute, and this is why I stopped worrying about it.”
2. In use
“Laptop, lunch box, charger, and it still zips shut.”
3. Feature to moment
“Phone and wallet go here, against my back, where nobody can reach them.”
4. Like a person
“And it doesn’t look like a trekking bag when I walk into a meeting.”
5. Fast close
“This is the one I carry every day.”
Read them out loud. The first tells you the bag has an anti-theft pocket. The second shows you the crowd and the hand that cannot reach your phone, which is the reason anyone wants an anti-theft pocket in the first place. Both scripts sell the same bag, and they make completely different ads.
How do you brief creators for demonstration UGC?
With five questions the creator has to answer on camera, not a list of features to mention. The brief fits on one card.
Five questions, one card
What is the Adbuffs Demo Brief?
1. Hook. What problem or surprising use can we open on in the first three seconds?
2. In use. What real situation does the buyer live in, and where does the product show up in it?
3. Features as moments. For each feature, what is the scene where it solves something? If we cannot film it, we cut it.
4. Like a person. Would a real customer say this sentence to a friend?
5. Fast close. Can we cut any second before the viewer understands why to buy?
Judge the result on the chain: cost per 1,000 impressions ÷ (click-through rate × conversion rate × 1,000) = cost per purchase.
Did the demonstration alone cause the lower cost per sale?
The data cannot say. The comparison is one ad against one other, for a different bag at a different order value. Nothing shows the two ran over identical dates or to matched audiences, so product and timing are part of the gap. ROAS here is Meta’s own 7-day click, 1-day view figure, which also credits some buyers who would have found the brand anyway. We read first-click ROAS beside it, as we explain in our post “Why your Google Ads ROAS falls apart when you scale it”. The clean version of this test is two creatives for the same product, with the same budget and dates, in a Meta A/B test.
What the data does support is narrower and more useful. When conversion rate after the click is about the same, most of a gap in cost per sale comes from before the click, and here about four-fifths of it came from the lower cost per 1,000 impressions.
Questions people ask us about UGC





 · Nov 20, 2026