Your best Google campaign is probably collecting, not acquiring
Most brands read Google’s ROAS straight off the Google Ads dashboard and set budgets from it. That number is reported on last click, and last click hands the whole sale to whichever ad was clicked just before checkout.
Think about how people actually buy from a D2C brand in India. Someone sees you in an Instagram Reel, does nothing for a week, then types your brand name into Google, clicks the top result, which is your ad, and buys. Google Ads books that sale as its own. Meta, which did the real work, gets nothing, and your branded search campaign posts a ROAS that would make anyone want to double it.
So you double it, and the ROAS halves. Nothing broke. The number of people already searching for your brand does not rise because you spent more on Google, so the extra money spills into colder, broader auctions where those campaigns never had to compete before. The account was never as good as it looked at the old budget.
You can usually spot an account in this state from four signs:
- ROAS drops every time budget rises. The account holds at one spend level and degrades at any higher one.
- Google moves with the other channels. When Meta spend or organic traffic dips, Google conversions dip a few days later.
- Branded terms carry most of the conversions. Strip out brand search and the rest of the account looks much weaker.
- New users stay flat. Reported revenue climbs while the count of first-time visitors from Google barely moves.
The trap in one line
If you scale Google on its last-click ROAS, you pour money into the campaigns that collect your demand and starve the ones that create it.
The Adbuffs Two-ROAS Read
The fix is not a new campaign type. It is a second number, read next to the one you already have. We first built this read for Meta, in The profit truth behind ROAS, and it carries over to Google without changes.
The Adbuffs framework
The Two-ROAS Read, applied to Google
Rule one. Read both numbers. Put the ROAS Google Ads reports, which is last click, next to first-click ROAS, which credits Google only for customers it introduced.
Rule two. Scale on first click. A campaign earns more budget when Google is the first touch for its buyers, whatever its last-click number says.
Rule three. Count the halo. Add the revenue that Google-introduced customers later spend on other channels. We call it the Adbuffs First-Click Halo, and last-click reporting hides all of it.
First-click ROAS = revenue from customers whose first visit came from Google Ads ÷ Google
Ads spend
Adbuffs First-Click Halo = that revenue, when it is booked in a later session from any source other than Google Ads
The gap between the two ROAS figures is the most useful diagnostic you have. A campaign with a strong last-click ROAS and a weak first-click ROAS is collecting buyers who were already on their way. A campaign whose first-click ROAS holds close to its last-click number is finding new ones, and that is the campaign that can take more money.
Google gets the credit
Google was the customer’s first touch. Any later purchase, on any channel, counts toward Google’s first-click revenue.
Google gets no credit
The customer found the brand somewhere else and only converted through a Google click. That sale belongs to the channel that started the journey.
Why first click is the conservative read
Every customer has exactly one first touch, so no sale gets counted twice across channels. Add up last-click ROAS across Google and Meta and the platforms claim more revenue than the business made. Add up first-click revenue and the total matches.
The read is only as good as the tracking under it. Ad blockers and browser privacy limits drop part of the visit data that first click depends on, the same signal problem we covered in Meta only sees 1% of your customers. On the account below, events were captured server-side with Blotout’s EdgeTag, a first-party tracking layer that records first-touch and last-touch outcomes on the brand’s own infrastructure.
What this looks like on a live account
Below is a D2C fashion brand we run in India. First-click purchase tracking went live on 4 June 2026, and from that date the Google budget followed first-click results instead of the last-click number that had kept collapsing on scale.
On these numbers
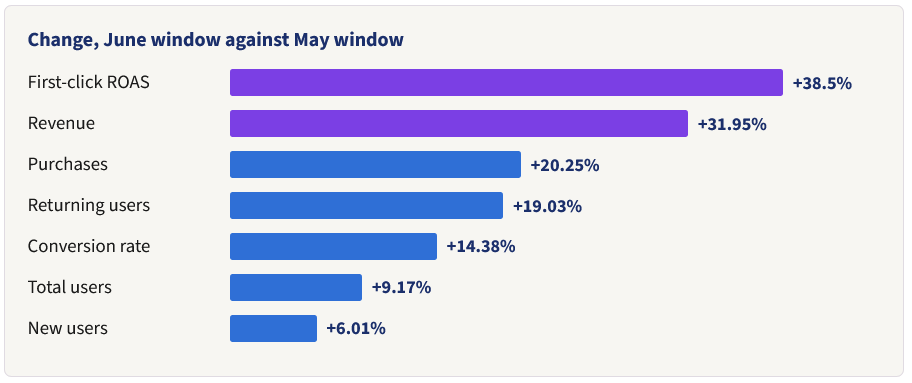
These are real GA4 figures from an account we operate. The brand is anonymised and its account name is removed from the screenshots; the numbers themselves are not adjusted. The comparison is the 31 days from 4 June against the 31 days before, for every user whose first visit came from a Google ad.
Google first-click account . first user source = google / cpc
The number to watch is quality, not volume: revenue grew faster than purchases, 31.95% against 20.25%, because the average first-click order rose from about ₹1,071 to about ₹1,175. Conversion rate went from 3.11% to 3.56%. When you push budget into colder auctions on a last-click signal, both of those numbers fall. Here they rose, because the money went to campaigns that were finding buyers rather than chasing them.
Returning users grew 19.03% against 6.01% for new users. People whose first visit came from a Google ad kept coming back, which is what acquired customers do and what one-off harvested buyers rarely do.
GA4 user acquisition exploration filtered to first user source/medium google / cpc, showing purchase revenue of ₹2,50,74,762 against ₹1,90,03,284, 21,334 purchases against 17,742, and a 3.56% purchase rate against 3.11%.
GA4 Exploration, first user source/medium = google / cpc. Account name removed.
The revenue Google starts and never gets paid for
This is the part last-click reporting never shows you. On the same account, users whose first visit came from a Google ad went on to spend ₹15.02 L through Meta placements and other non-Google sessions in the June window, up 36.99% from ₹10.97 L. Purchases on that path rose from 1,109 to 1,410. In a last-click report, every rupee of it sits under Meta.
Google-introduced customers, by the channel they later bought through
The halo does not land evenly, so read it placement by placement. Instagram Reels and Facebook carried ₹9.31 L of the ₹15.02 L, about 62%. The two FB Mobile placements show the biggest percentage jumps, but they grew from May bases of about ₹7,800 and ₹12,700, so they matter far less than the top two rows. Instagram Feed went the other way: users rose 26.69% while purchases fell 16.56%, which tells you that placement is converting Google-introduced visitors worse than it did a month earlier.
GA4 exploration of users first acquired by Google Ads who later bought through Meta sessions,
showing %15,02,121 of purchase revenue in June against ¥10,96,524 in May, by Instagram Reels,
Facebook, Instagram Feed and Instagram Stories.
GA4 Exploration, first user source = google / cpc, by later session source. Account name removed.
Google-introduced users also came back through Google itself. Later sessions with Google as the source produced ₹13.46 L in June against ₹11.53 L in May, from 766 purchases against 682. The view behind that figure groups sessions by source only, so it mixes organic search visits with any later Google ad clicks. Treat it as the upper limit of the organic return; step 5 in the method below splits the two.
GA4 exploration of users first acquired by Google Ads who later bought in sessions from Google,
showing %13,45,703 of purchase revenue in June against ¥11,53,242 in May, and 766 purchases against 682.
GA4 Exploration, first user source = google / cpc, later session source = google. Account name removed.
Be honest about what this is
First click tells you where a customer started. It does not prove Google caused the purchase, and this is one 31-day window against the 31 days before it, in a season where June can carry demand that May did not. Both windows come from the same GA4 report, so the method holds steady, but the causal answer still needs a holdout test: switch a channel off in a region or a window and watch what actually happens. We cover how in The one number that tells you if you’re actually growing. A first-click read points you at the right experiment rather than replacing it.
The terms, stated plainly
Running the read on your own account
GA4 already stores where every user’s first visit came from, so you need no new tool to start, only an Exploration built the right way and the discipline to act on it.
- Build the Exploration. In GA4, open Explore, start a Free form exploration, add the dimension First user source / medium and filter it to exactly google / cpc.
- Add the metrics. Key events set to purchase, Purchase revenue, New users and Returning users.
- Compare equal windows. Two periods of the same length, four to five weeks each, so weekly cycles cancel out.
- Work out first-click ROAS. Divide first-click purchase revenue by Google Ads spend for the same window and put it beside the ROAS Google reports.
- Find the halo. Add Session source / medium as a second dimension. Use source and medium together so that later organic visits and later paid clicks from Google stay on separate rows.
- Split brand from non-brand. Brand search mostly collects people who already know you. Run it separately so it stops flattering the read on acquisition.
- Move budget to the first-click winners. Widen discovery with Performance Max, Demand Gen and Shopping, and exclude past customers, or those campaigns drift back to the cheapest buyers you already have.
- Set bid targets from first-click value. A target ROAS taken from last-click results tells Google’s bidding to chase harvest. Base it on what campaigns earn on first click.
- Plan the holdout. Use the read to pick which campaign to test with ads switched off, not to declare victory.



 · Oct 14, 2026