Adbuffs

← Blog
By the numbers

Your landing page is the cheapest hedge against rising CPMs

Abhishek Maity, Co-founder, Adbuffs
October 29, 2026
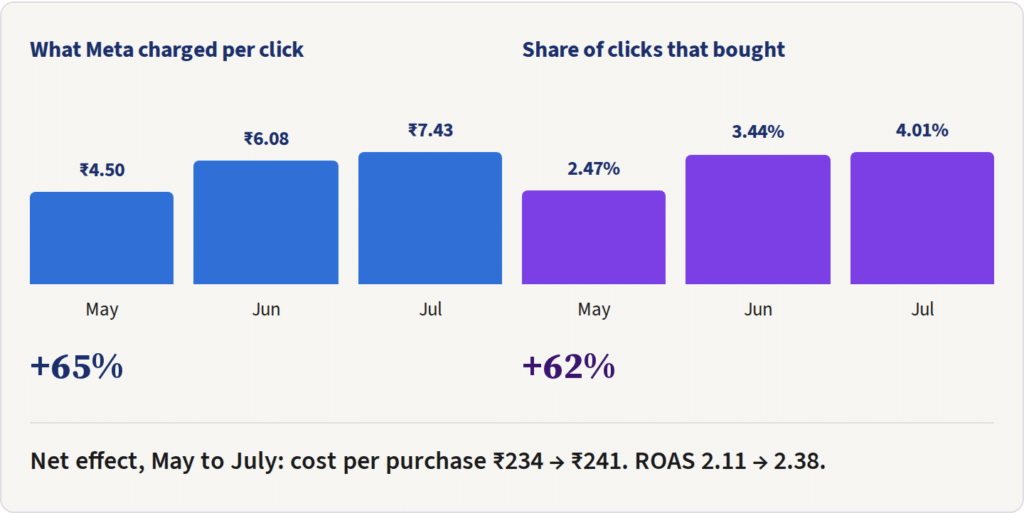
Between May and July, the cost of a click on one of our accounts went up 65%. Over the same three months, the share of clicks that turned into a sale went up 62%. Those two numbers nearly cancelled out, and that is the whole story of why landing page work belongs in a media plan.
In short
When the cost of traffic rises, the only lever that offsets it without touching the media plan is the page people land on. On a D2C natural hair colour account, sending ads to one product page with every shade and multi-pack option on it, plus a faster checkout, lifted conversion rate from 2.47% to 4.01%. Over the same months, cost per click rose 65%, so the page work held cost per purchase almost flat when it would otherwise have climbed sharply.

The traffic was fine. The page was making people work.

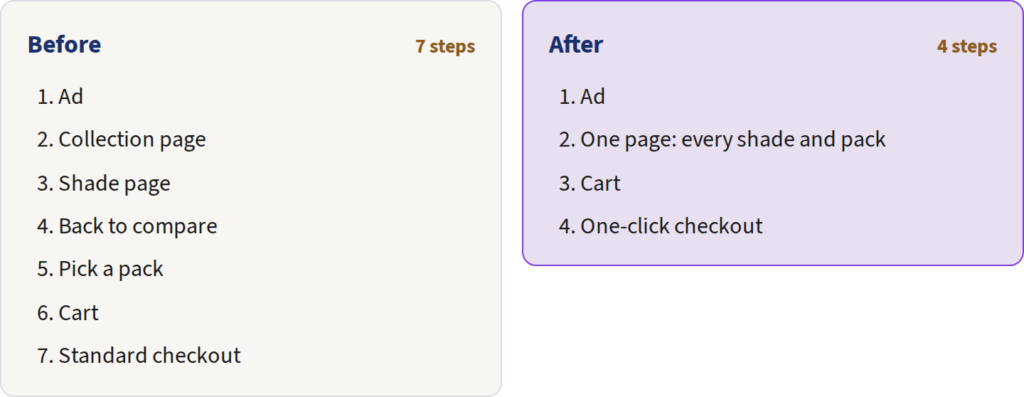
The brand sells natural hair colour in several shades and in packs of two or three. Its Meta ads sent people to a collection page. To buy, a shopper had to open a product page for one shade, go back, open another to compare, and then work out which pack size to choose, one page at a time. Every extra page is a point where someone on a phone gives up.

Meta’s numbers already said the ads were doing their job: people clicked. The drop happened after the click, so buying more traffic would only have bought more drop-off. We studied how customers moved through the site and how competitors laid out shade selection, and the fix was to stop sending ads to the collection page at all.

The new page showed every colour in one place and let shoppers mix shades inside a Buy 2 or Buy 3 pack. Calls to action became clearer and more prominent, the layout was simplified, and the checkout moved from Shopify’s default to GoKwik, a one-click checkout widely used by Indian D2C brands.

Read the funnel one stage at a time

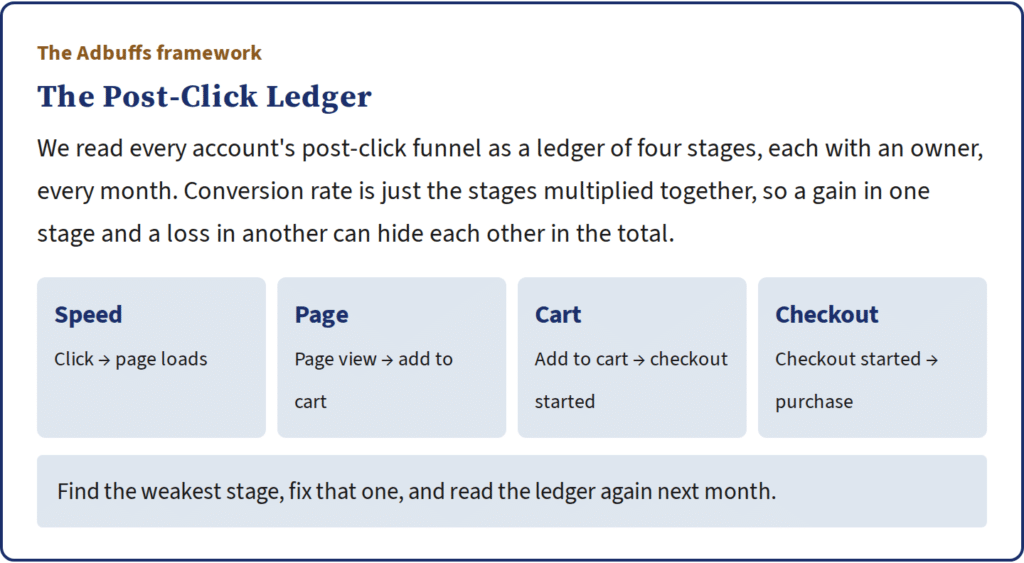
A single conversion rate hides where things changed. Split it into the stages between the click and the sale, and each stage points at a different part of the site.
May against July, Meta Ads Manager account totals
StageWhat it testsMayJulyChange
Click → page loads Page speed 69.5% 75.3% +8%
Page view → add to cart The page itself 10.7% 15.9% +49%
Add to cart → checkout started Cart and checkout entry 74.8% 90.3% +21%
Checkout started → purchase Checkout completion 44.6% 36.9% −17%
Conversion rate All of the above 2.47% 4.01% +62%
The biggest single gain is the page itself: the share of visitors adding to cart rose by about half once they could see every shade and pack on one screen. More clicks also turned into page views, which is the page speed work showing up (more on that below). More carts moved into checkout after the switch to one-click checkout.
The last line is the one to watch. A smaller share of started checkouts finished, down from 44.6% to 36.9%. Easier checkout entry pulls in people who are less committed, so some drop is normal, but it is now the weakest stage in the funnel and the next thing to work on.

Why ROAS barely moved, and why that is the win

If conversion rate rose 62%, why did ROAS only go from 2.11 to 2.38? Because the auction got more expensive at the same time. Cost per 1,000 impressions rose 45% between May and July, and cost per click 65%.
Costs against conversion, May to July
MetricMayJuneJuly
Cost per 1,000 impressions ₹66.73 ₹76.46 ₹96.67
Cost per click ₹4.50 ₹6.08 ₹7.43
Conversion rate 2.47% 3.44% 4.01%
ROAS 2.11 2.40 2.38
Spend ₹13.18 L ₹9.61 L ₹11.37 L
Run the rough arithmetic the other way. If July’s clicks had converted at May’s rate, at July’s prices, ROAS would have been about 1.5 instead of 2.38, assuming the same order value. That is the gap the landing page work closed, by getting more out of every click the account paid for. It is also why we judge growth on blended efficiency rather than one platform’s ROAS, as we explain in The one number that tells you if you’re actually growing.
ROAS also rose slightly more than conversion rate and cost per click alone would predict, which suggests orders got a little larger. That fits a page built around Buy 2 and Buy 3 packs, though the data here does not show order value directly.

Speed is part of the page

The first version of the new page was heavier than the old one, and on some days it showed it: slower loads and Core Web Vitals problems, Google’s measures of how fast and stable a page feels. A page that converts better but loads slower can give back everything it gained, because people leave before they see it.
We sent the brand’s team continuous feedback on image sizes, load speed and Core Web Vitals until the page held its features without the weight. The ledger shows it worked: the share of clicks that became page views rose from 69.5% to 75.3%, so about six more people in every hundred who clicked actually saw the page.

Caveats

Several things changed together, so the gain cannot be split cleanly between the page, the checkout and the speed work. Spend dropped in June and creative testing continued throughout, both of which affect who reaches the page. Conversion figures are Meta-reported. The case study reports conversion rate as 2.4% to 4.06% (+69%) using a different view of the same account; we use the single month-by-month table, 2.47% to 4.01% (+62%), so every month comes from one source. A controlled version would split traffic between the old and new page over the same dates.
If you take three things from this
  • When cost per click rises, conversion rate is the lever that protects ROAS without changing the media plan. On this account, a 62% lift in conversion rate offset a 65% rise in cost per click.
  • Send paid traffic to one page that answers every buying question, such as shade and pack size, instead of a collection page that makes people browse.
  • Read the funnel stage by stage with the Adbuffs Post-Click Ledger, because a gain in one stage can hide a loss in another.

What founders ask us about landing pages

Should I send Meta ads to a collection page or a product page?
Usually a product page that answers every buying question in one place. On one D2C hair colour account, moving ads from a collection page to a single product page showing every shade and pack option lifted add-to-cart rate by about half and conversion rate from 2.47% to 4.01%.
Improve conversion rate after the click. On one account, cost per click rose 65% between May and July while conversion rate rose 62%, so cost per purchase held almost flat and ROAS rose from 2.11 to 2.38 instead of falling.
It varies by category, price and traffic source, so track your own funnel month by month rather than chase a benchmark. Split conversion rate into page load, add to cart, checkout started and purchase, and fix the weakest stage.
It can raise the share of carts that start checkout, as it did on this account, from 74.8% to 90.3%. Watch the next stage too: a smaller share of started checkouts finished, because easier entry brings in less committed shoppers.
Yes, if it loads slower. A heavier page can lose visitors before they see it. Check the share of clicks that become page views after any redesign, and fix image sizes and Core Web Vitals before judging the page.

Glossary

Conversion rate
The share of ad clicks that end in a purchase.
The page an ad sends people to. For paid traffic, usually a product page or a dedicated page rather than the home or collection page.
A page that lists several products, which shoppers browse to reach individual product pages.
The Adbuffs method of reading the funnel after the click as four stages, speed, page, cart and checkout, and fixing the weakest one each month.
Google’s measures of how quickly a page loads, how soon it responds and how stable its layout is.
A checkout that fills in saved details so returning shoppers can pay in fewer steps. GoKwik is one provider used by Indian D2C brands.
Ad spend divided by clicks.
In one paragraph
Summary for fast readers
Rising ad costs are usually treated as a media problem, but the landing page is the lever that offsets them. On an anonymised D2C natural hair colour account in India, ads were moved from a collection page to one product page showing every shade with mix-and-match Buy 2 and Buy 3 packs. The team also added clearer calls to action, a one-click checkout and page speed fixes. Conversion rate rose from 2.47% in May to 4.01% in July while cost per click rose 65%, so cost per purchase held at about ₹234 to ₹241 and ROAS rose from 2.11 to 2.38. The Adbuffs Post-Click Ledger reads the funnel as four stages, speed, page, cart and checkout, and shows the biggest gain came from add-to-cart on the new page.
Related concepts
Data: one anonymised D2C natural hair colour account in India, Meta Ads Manager, May to July 2026.

Other Posts that you may Like

9 MIN READ

UGC ads work when they demonstrate the product

True Omnichannel MER is Adbuffs’ measure of real efficiency — net-delivered revenue across D2C, marketplace, and quick-commerce, over fully-loaded spend.

Avatar photo Abhishek Maity, Co-founder, Adbuffs
→
15 MIN READ

Why Meta keeps selling your cheapest products

True Omnichannel MER is Adbuffs’ measure of real efficiency — net-delivered revenue across D2C, marketplace, and quick-commerce, over fully-loaded spend.

Avatar photo Abhishek Maity, Co-founder, Adbuffs
→
Scroll to Top