06 — Going one level deeper
Marketing mix modelling is cheaper than you have been told
MER tells you the machine is profitable. It does not tell you which lever is doing the work. For that you want a marketing mix model, and the dirty secret is that it is no longer expensive.
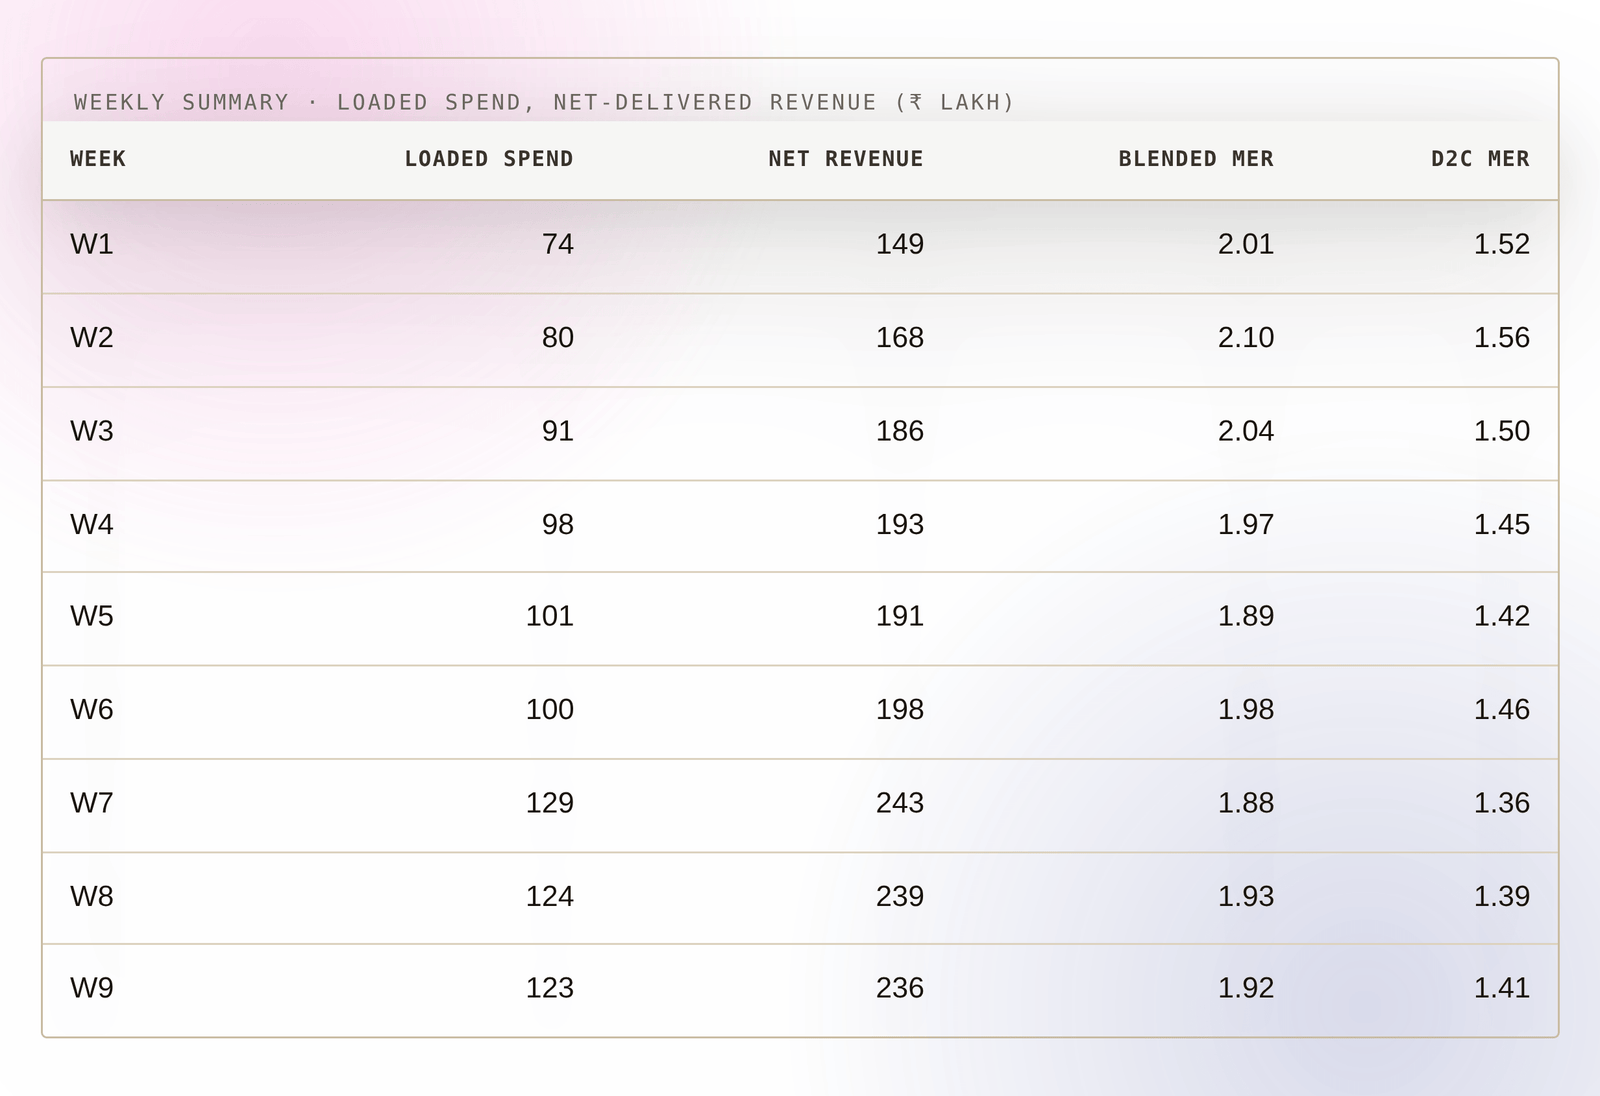
MMM has a fearsome reputation: six-figure engagements, a data science team, months of work. Most of that cost was never the statistics. It was assembling clean, consistent, channel-level spend and revenue, week after week, in one place. The kind of sheet we have been looking at in this article is that data. Once it exists, the modelling itself is an afternoon.
What a model actually does
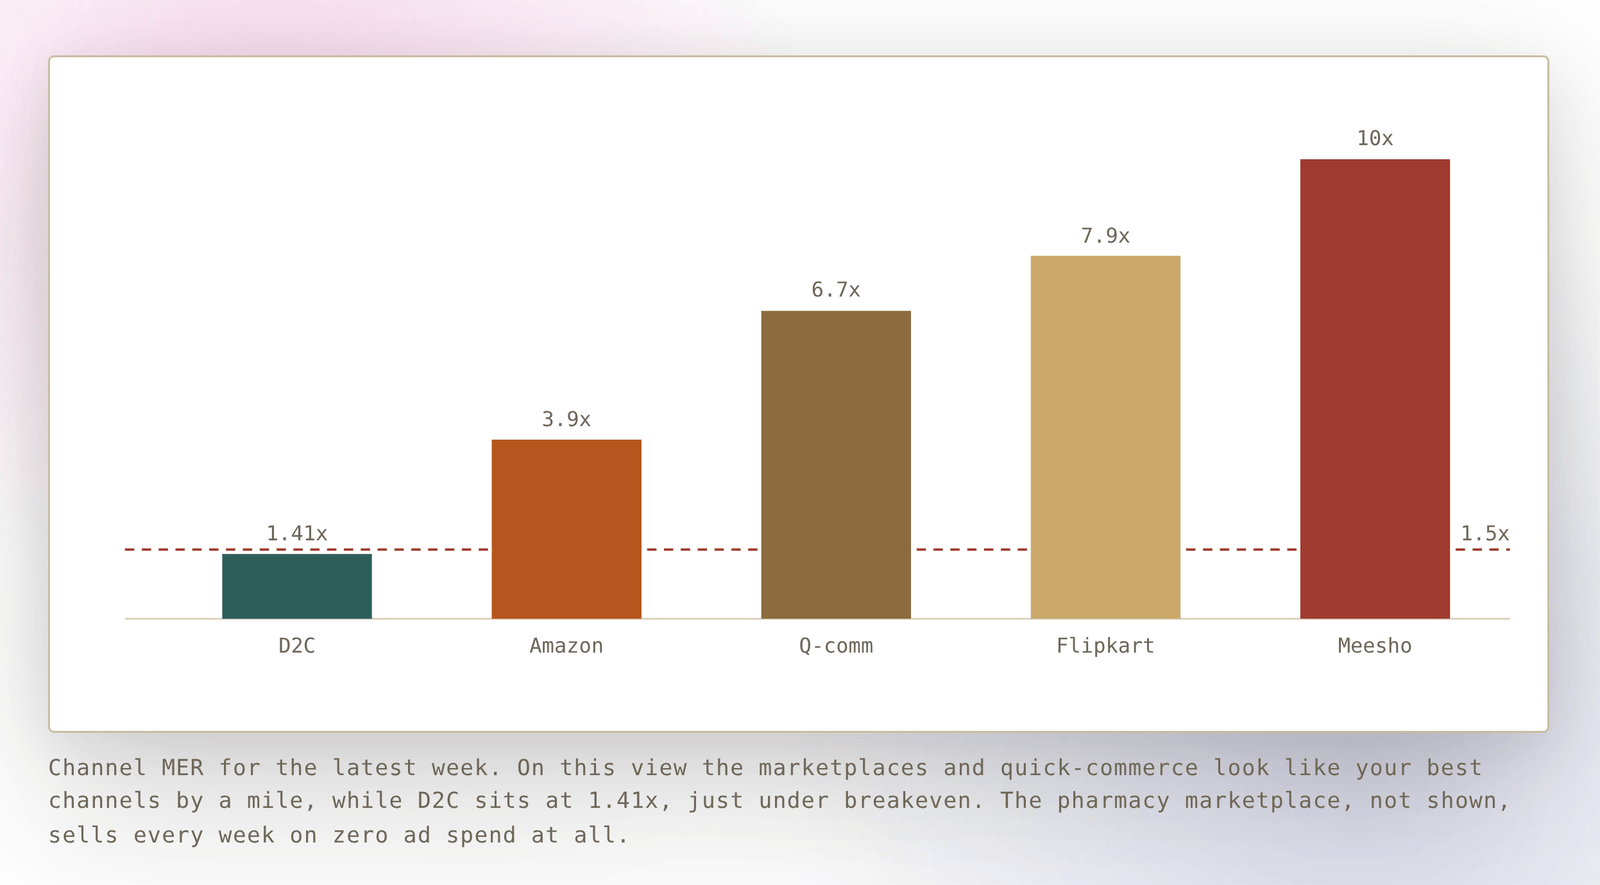
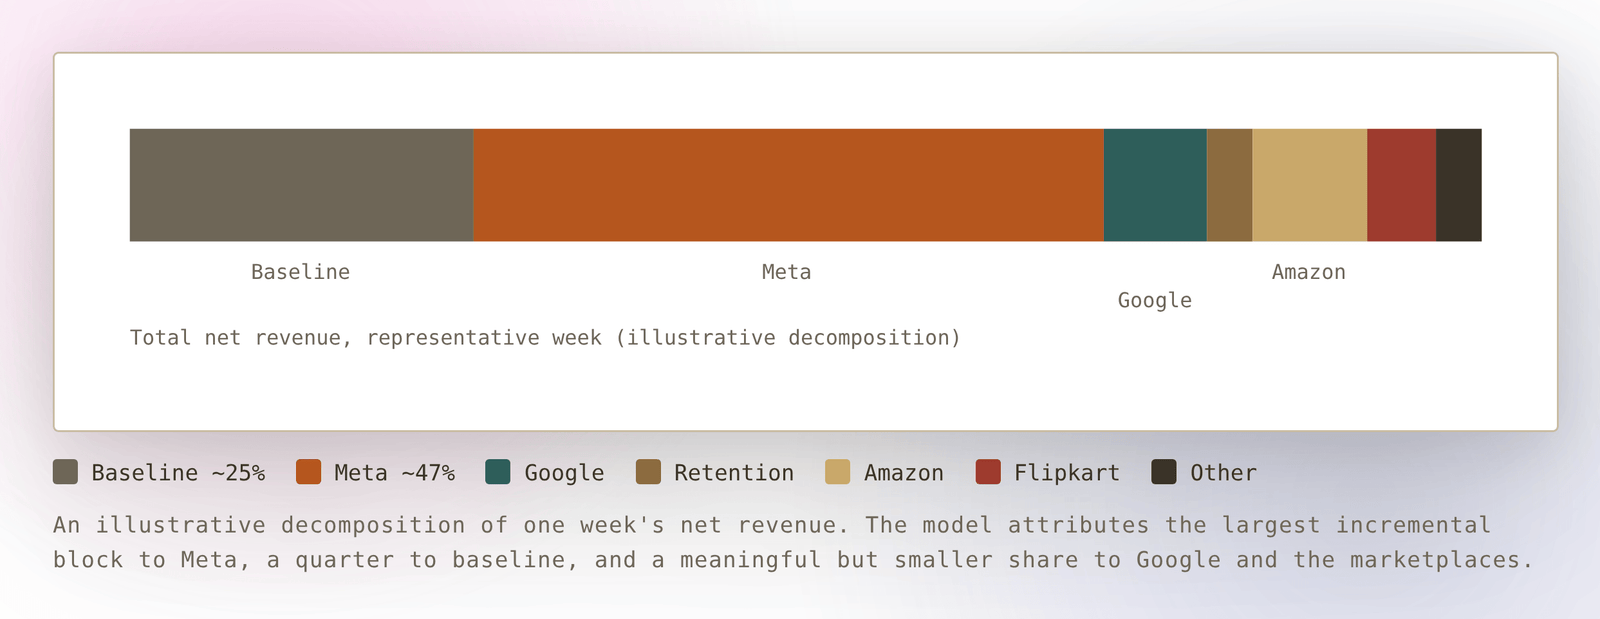
It looks at how revenue moves as each channel’s spend moves over many weeks, and splits total revenue into two things: a baseline you would keep at zero spend, and an incremental contribution from each channel on top. The pharmacy marketplace in our account shows the baseline in the open, steady sales on zero ad spend, around ₹2L a week. The model’s full baseline is far larger, roughly a quarter of revenue, because it also captures repeat buyers, organic and brand demand, and sales that paid channels created earlier and that land later without a click. That last part is a warning, not a free win. A simple model can park lagged halo in the baseline, which overstates how much revenue would actually survive if you cut spend. The only clean way to tell true baseline from lagged halo is a holdout test.
The bridge between the two views
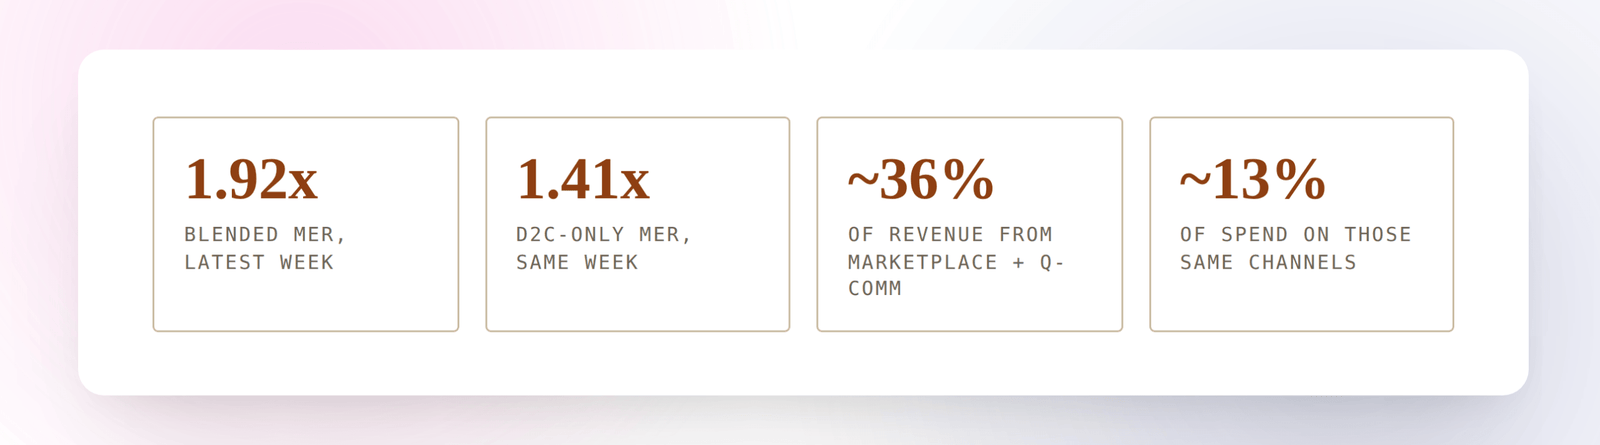
Earlier, the channel cut showed marketplaces at about 36% of revenue. Here the model puts them at only about 17% of incremental contribution. The missing 19 points did not disappear. The model hands them to Meta, Google and baseline, because that is what created the demand the marketplaces banked. Same rupees, finally credited to the channel that earned them. That is the halo, measured.
How to read it, and what it answers
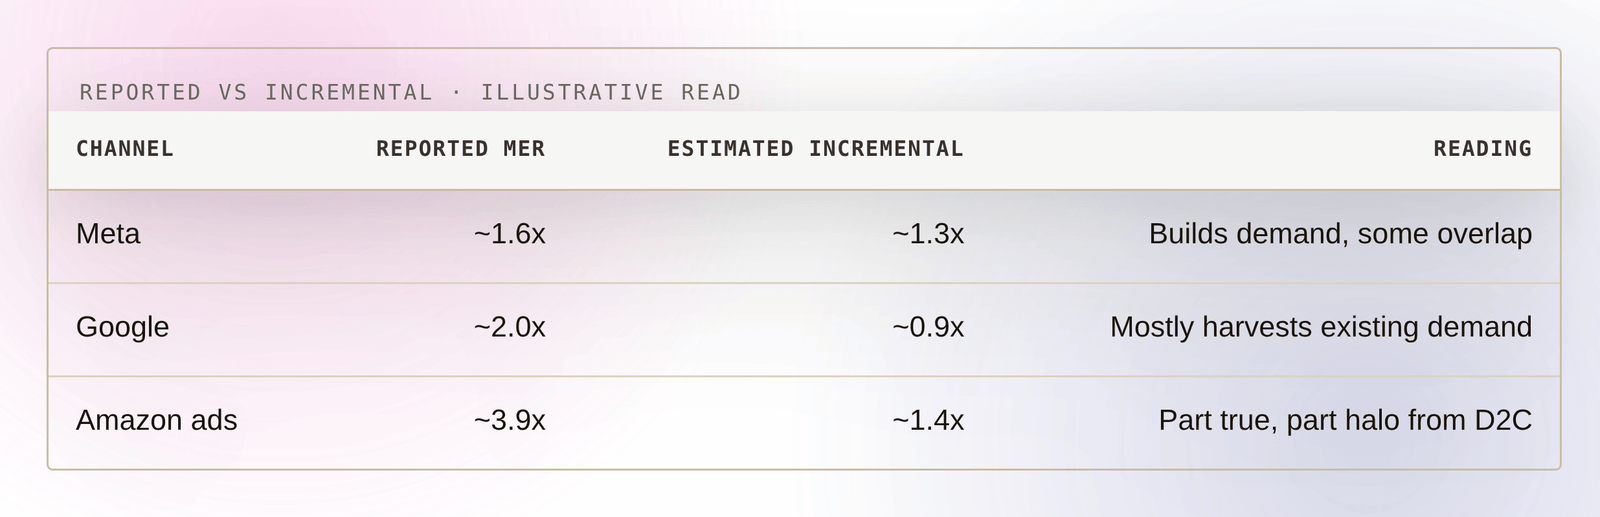
This is where you answer the questions that keep founders up at night. What is my Amazon revenue really worth if I am also running Amazon ads, and how much of it would arrive anyway? Which of Meta and Google is moving the business, and which is just collecting buyers I already had? The model gives you a per-channel incremental contribution, the extra revenue you get for the next rupee, and you compare it against that channel’s reported MER.
Add the reported side up and it attributes more revenue than the business actually made. That is not a mistake in the table. It is every channel claiming the same buyers, which is exactly the double-count this whole article is about. The gap between the two columns is the lie ROAS was telling. Google looks like the best channel on reported MER and the weakest on incremental, because it captures people who were already searching your brand. Meta looks ordinary on reported MER but is doing the heavy lifting of creating demand the other channels then bank. This is the same truth our incrementality work reaches from the other direction.
Be honest about what this is
The numbers in this section are a directional, illustrative first-pass, not an audited model. A quick read like this has real limits: channels often scale together, which muddies the estimates; a straight line ignores diminishing returns; and correlation is not proof of cause. For a genuine causal answer you still run a holdout test, switching a channel off in a region or a window and watching what actually happens. A first-pass model points you at the right experiment. It does not replace it.
The point stands though. The expensive part of MMM was the data discipline, and if you are already keeping a weekly loaded, net-delivered sheet for your MER, you have paid that cost. Feeding that table to a capable model and asking it to estimate the baseline and per-channel contribution is fast and cheap. For very large budgets and big media bets you will still want a specialist and a proper validated model. For a founder who wants to know which channel is actually building the business, the barrier is gone.





 · Sep 14, 2026